

Mineral trade
Fluorspar: world exports by country
The leading exporters of fluorspar in 2025 (provisional): their rank, share and trend. Free; the values and prices are in the world minerals dashboard.
HS codes: 252921, 252922
Top 10 exporters in 2025 (provisional)
| Rank | Country | Share |
|---|---|---|
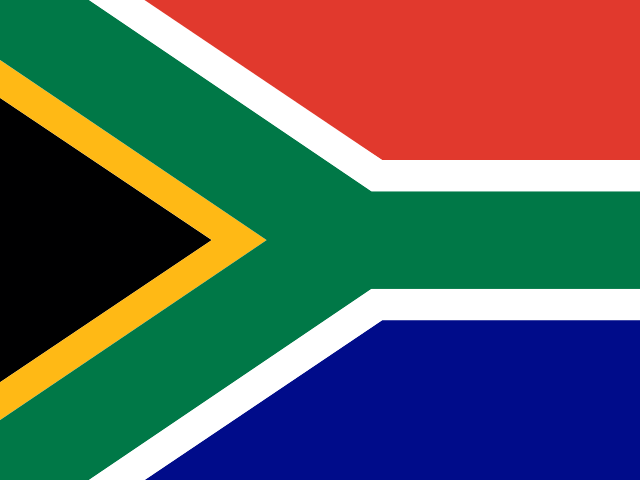
| #1 | South Africa | 27.9% |
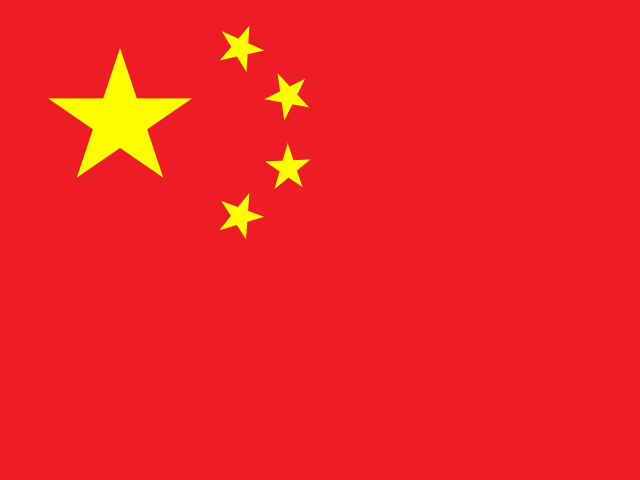
| #2 | China | 27.1% |
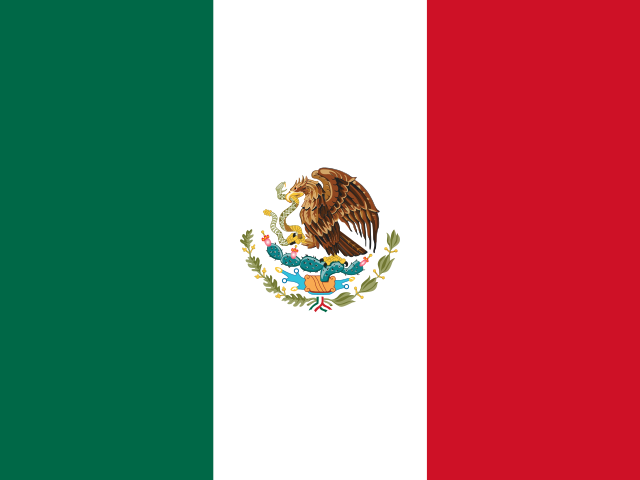
| #3 | Mexico | 10.7% |
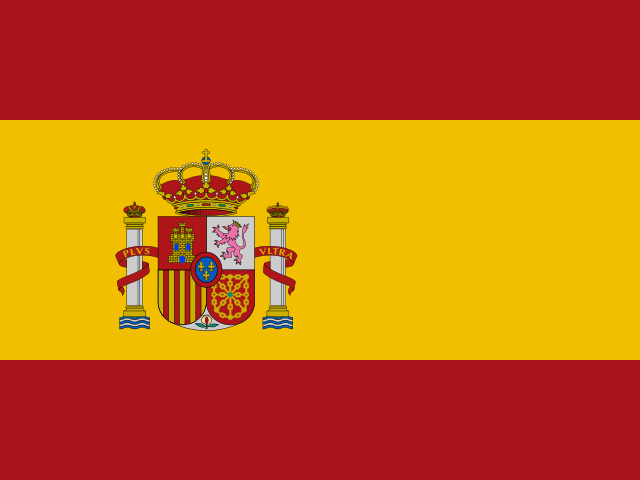
| #4 | Spain | 7.5% |
| #5 | Netherlands | 5.2% |
| #6 | Italy | 4.9% |
| #7 | Germany | 4.2% |
| #8 | Pakistan | 2.5% |
| #9 | Thailand | 2.5% |
| #10 | Czechia | 1.4% |

The three largest exporters account for 65.7% of the total listed.
All exporting countries
- Armenia
- Australia
- Austria
- Belarus
- Belgium
- Bosnia & Herzegovina
- Brazil
- Bulgaria
- Canada
- Chile
- China
- Côte d’Ivoire
- Czechia
- Denmark
- Djibouti
- Egypt
- Finland
- France
- Germany
- Ghana
- Greece
- Guatemala
- Hong Kong SAR China
- Hungary
- India
- Indonesia
- Iran
- Ireland
- Israel
- Italy
- Japan
- Kazakhstan
- Kenya
- Kyrgyzstan
- Laos
- Latvia
- Lithuania
- Malawi
- Malaysia
- Mexico
- Moldova
- Mongolia
- Morocco
- Mozambique
- Myanmar (Burma)
- Namibia
- Netherlands
- Niger
- Nigeria
- Norway
- Oman
- Pakistan
- Peru
- Poland
- Romania
- Russia
- Senegal
- Singapore
- Slovakia
- Slovenia
- South Africa
- South Korea
- Spain
- Sri Lanka
- Sweden
- Switzerland
- Tajikistan
- Tanzania
- Thailand
- Türkiye
- Ukraine
- United Arab Emirates
- United Kingdom
- United States
- Uzbekistan
- Vietnam
- Zambia
- Zimbabwe




















Notes and source
This page shows indicators derived by KEYSTONE. (ranks, shares, growth rates, indices); the reported values and unit values are in the dashboards.
Ranks and shares are computed among the countries listed by the source (the top 50 exporters of each HS code), on values in US dollars at current prices. Each country is shown in the last year it has reported; the free pages show the last six years.
- Source: UN Comtrade, extracted 08-11-2026 · aggregated and converted by KEYSTONE. · The figures shown are KEYSTONE.'s processing, not official UN statistics.
- The latest year (2025) is provisional until UN Comtrade consolidates its annual data; figures extracted on 08-11-2026 and subject to revision.
- Scope: 47 HS codes (2501–2617, 2703, 6806). Values in USD at current prices; quantities in tonnes (net weight).