

Mineral trade
World mineral exports, mineral by mineral
Who leads world exports of copper, nickel, graphite, phosphates and 20 more minerals: world rank, share and growth in the latest year. Free and open to everyone; the values, prices and full series are in the dashboards.
Metal ores
Copper ores and concentrates
Top exporters · 2025 (provisional)



Top 3: 62.4% of the total
Nickel ores and concentrates
Top exporters · 2025 (provisional)



Top 3: 62.4% of the total
Aluminium ores (bauxite)
Top exporters · 2025 (provisional)
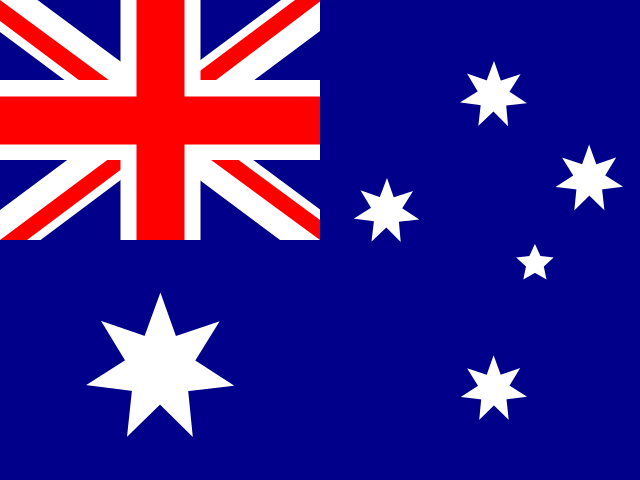

Top 3: 80.8% of the total
Lead ores and concentrates
Top exporters · 2025 (provisional)
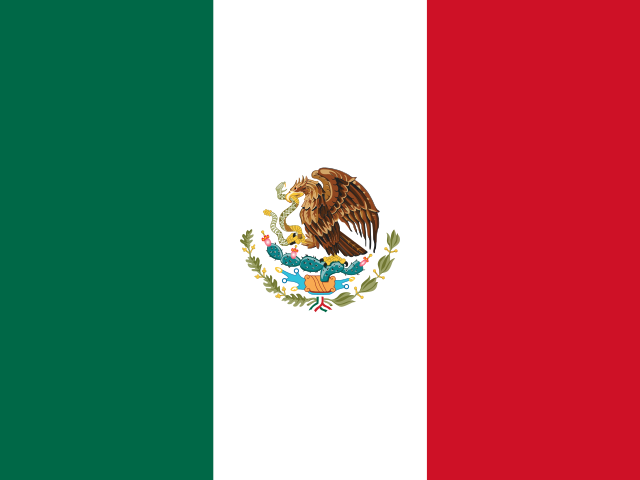
Top 3: 58.5% of the total
Zinc ores and concentrates
Top exporters · 2025 (provisional)

Top 3: 44.2% of the total
Tin ores and concentrates
Top exporters · 2025 (provisional)


Top 3: 80.7% of the total
Chromium ores and concentrates
Top exporters · 2025 (provisional)

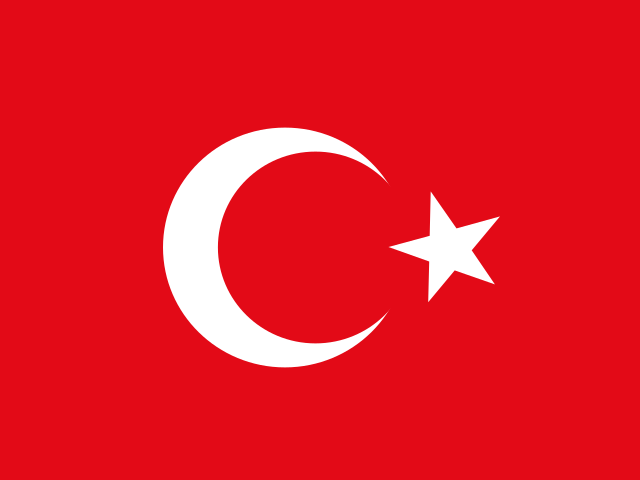

Top 3: 93.2% of the total
Tungsten ores and concentrates
Top exporters · 2025 (provisional)


Top 3: 56.2% of the total
Zirconium ores and concentrates
Top exporters · 2025 (provisional)

Top 3: 63.6% of the total
Precious-metal ores and concentrates
Top exporters · 2025 (provisional)
Top 3: 46.9% of the total
Industrial minerals
Natural graphite
Top exporters · 2025 (provisional)
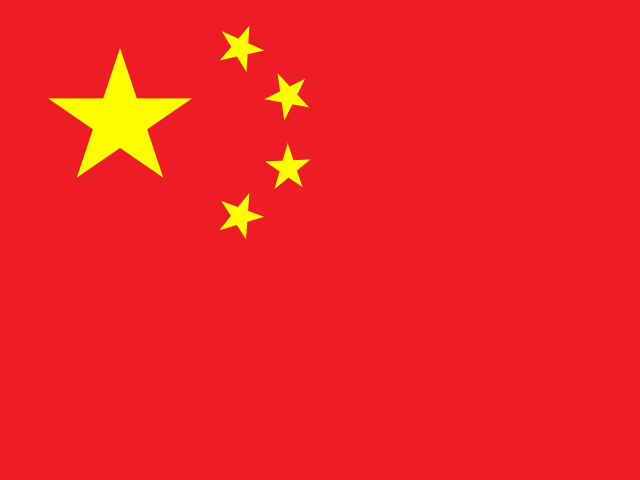


Top 3: 59.5% of the total
Fluorspar
Top exporters · 2025 (provisional)
Top 3: 65.7% of the total
Natural borates
Top exporters · 2025 (provisional)

Top 3: 84.8% of the total
Natural phosphates (phosphate rock)
Top exporters · 2025 (provisional)


Top 3: 71.5% of the total
Kaolin
Top exporters · 2025 (provisional)

Top 3: 59.5% of the total
Bentonite
Top exporters · 2025 (provisional)

Top 3: 49.7% of the total
Talc and steatite
Top exporters · 2025 (provisional)
Top 3: 38.0% of the total
Mica
Top exporters · 2025 (provisional)

Top 3: 63.1% of the total
Natural barytes
Top exporters · 2025 (provisional)
Top 3: 62.5% of the total
Sulphur
Top exporters · 2025 (provisional)
Top 3: 53.3% of the total
Magnesite and magnesia
Top exporters · 2025 (provisional)
Top 3: 60.0% of the total
Gypsum and plasters
Top exporters · 2025 (provisional)



Top 3: 39.8% of the total
Feldspar
Top exporters · 2025 (provisional)
Top 3: 66.3% of the total
Quartz
Top exporters · 2025 (provisional)
Top 3: 58.2% of the total
Salt
Top exporters · 2025 (provisional)
Top 3: 34.1% of the total
This page shows indicators derived by KEYSTONE. (ranks, shares, growth rates, indices); the reported values and unit values are in the dashboards.